 DASAPT
 Xinren Chen
A spatial distribution map (SDM) counts how often ions sit at a given distance along a pole.
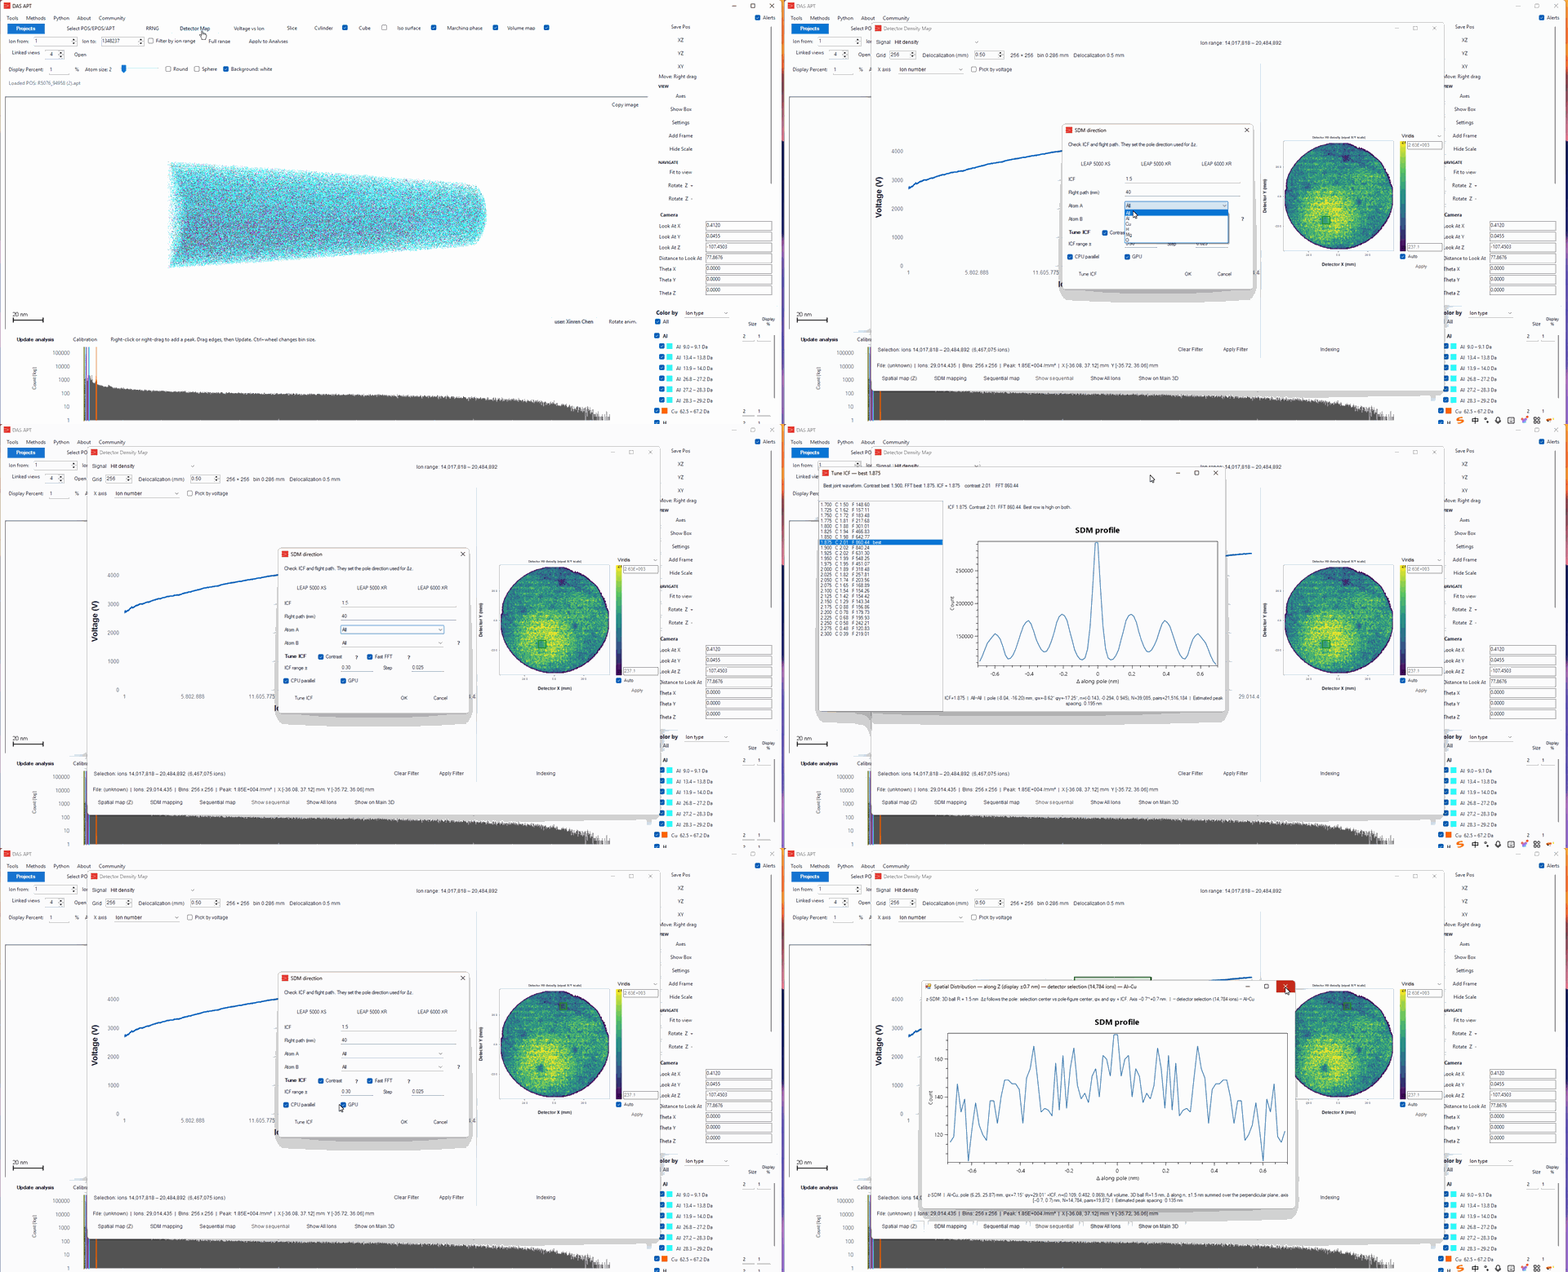
- Open a reconstruction that contains detector coordinates. Load a range file if you want to choose an atom pair.
- Click Detector Map.
- On the detector hit map, drag a square onto the pole you want. The square selects the ions. Its offset from the pole-figure center sets the direction of Δ.
- Click Spatial map (Z).
- Check ICF and flight path. LEAP 5000 XS is ICF 2 and 100 mm. LEAP 5000 XR and LEAP 6000 XR are ICF 1.5 and 40 mm.
- Atom A and Atom B choose the pair. All and All counts every pair. Al and Cu counts only Al next to Cu, in either order. The same name on both sides, such as Al and Al, counts only that ion next to itself.
- OK draws the SDM. The axis is Δ along the pole, from −0.7 nm to 0.7 nm. Neighbors are taken inside a 3D ball of radius 1.5 nm.
- Tune ICF tries a range of ICF values. The default range is ±0.30 and the step is 0.025. Contrast and Fast FFT are both on. The marked row is the waveform that is sharp and periodic. Click a row to see that curve.
0 comments
Sign in to comment.